ANDERTON
AR DATA VIZ EXPERIMENTS
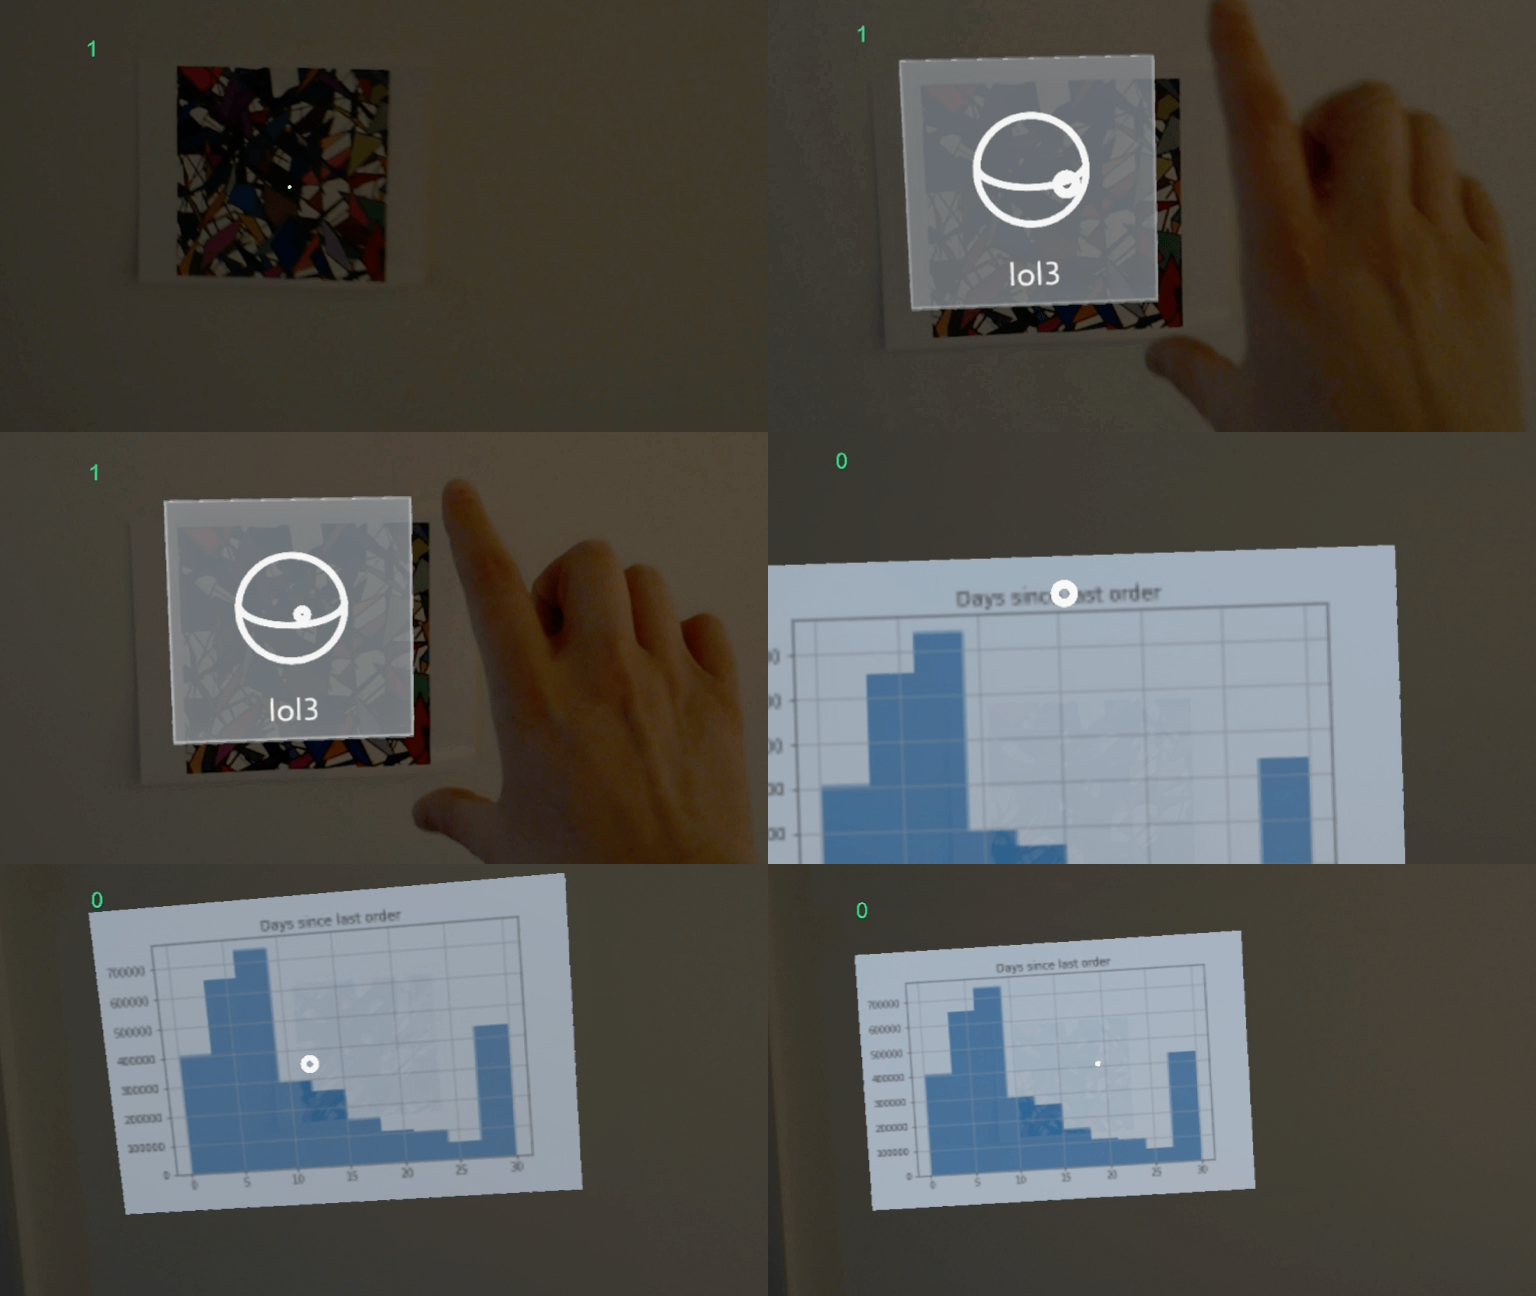
The first (above) is a demo of using AR as part of doing exploratory data analysis. Analysts write code in Jupyter Notebooks to make visualizations, then send important ones to the Hololens to display around them to take advantage of spatial memory as they work.
The second is a live audio spectrogram which listens to the microphone and displays the sound intensity at various frequencies in augmented reality. You can see it running on an iPad below.
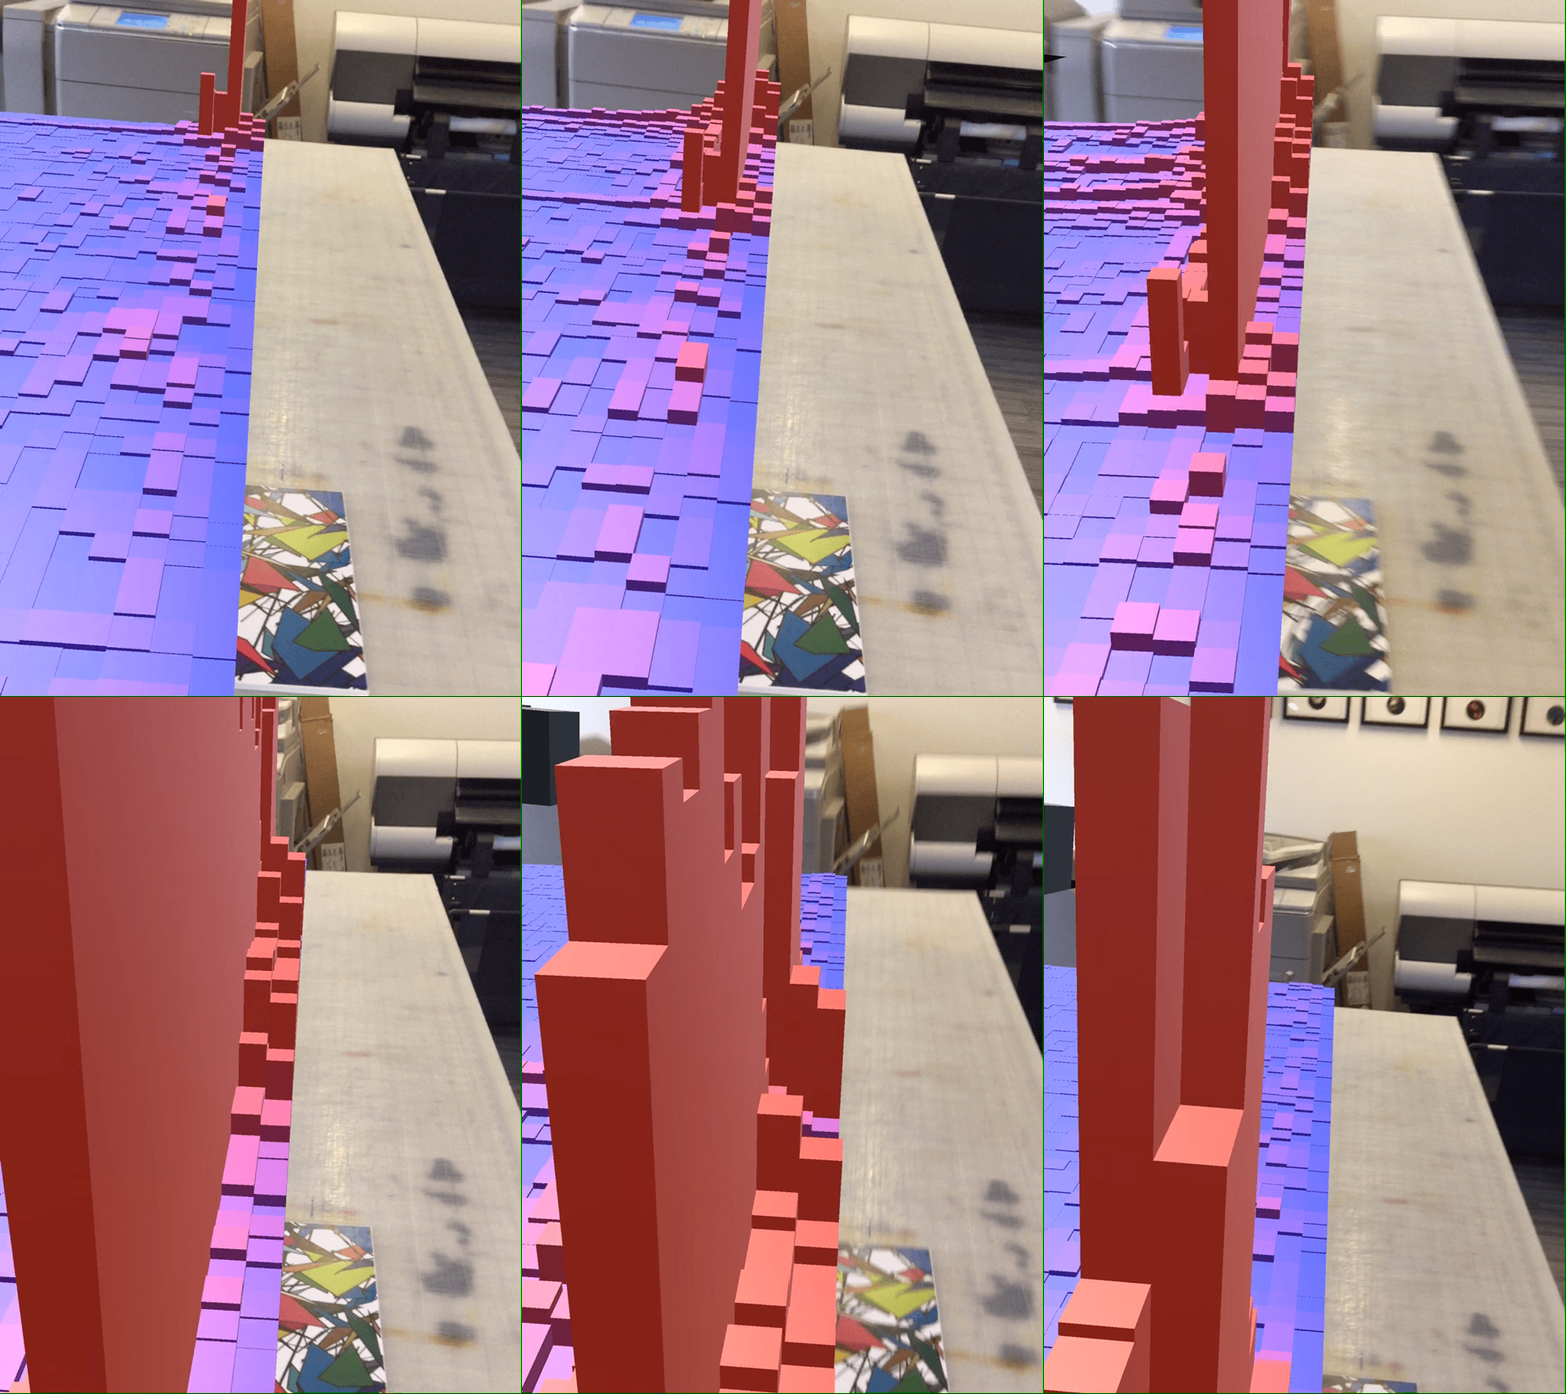
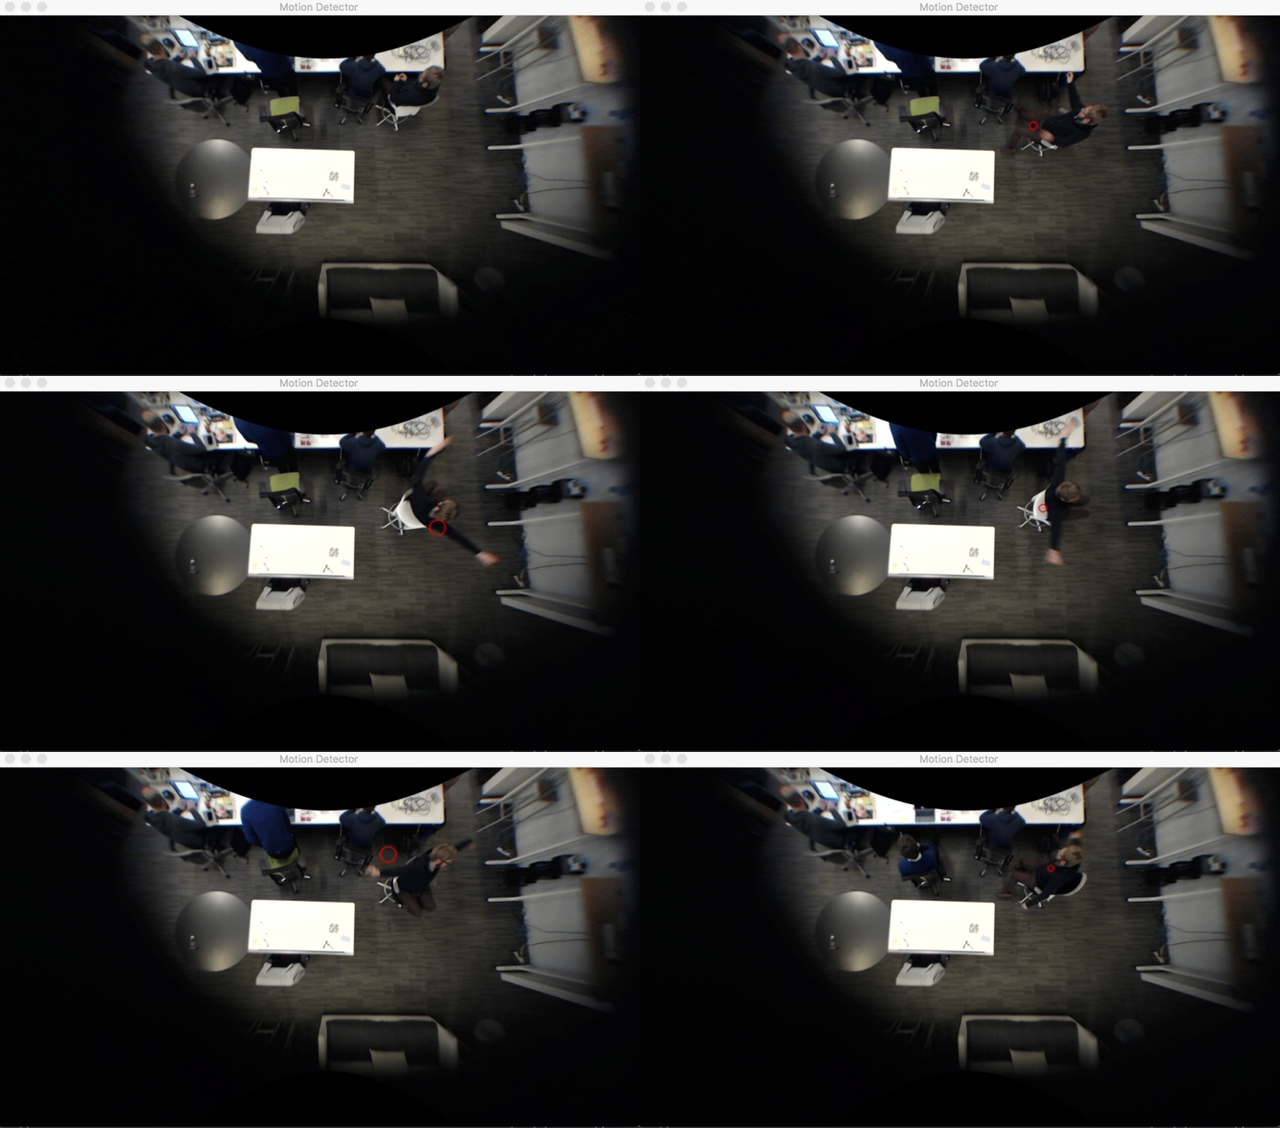
The final prototype is a “spatial histogram”, displaying where people spend time in an office. A camera was set up to detect motion and record the coordinates. The detected motions were then aggregated and displayed in AR on Hololens. This could be used to walk through the office and understand what parts are being taken advantage of or potentially underutilized.
These experiments highlighted the usefulness of being able to see data in the context in which it is captured, and in general the potential for AR to enhance productivity.


